1.2.4What is a composite function?
Composite and Inverse Functions
Given the two functions
State domain and range of
. State domain and range of
. What is
? What is
? What is
? Why is
undefined?

.png)
If
For example,
Explore this using the 1-62 Student eTool. Click in the lower right corner of the graph to view it in full-screen mode.
Given
State the domains and ranges of
and . Use interval notation. Write an equation for
and state its domain. Write an equation for
and state its domain.
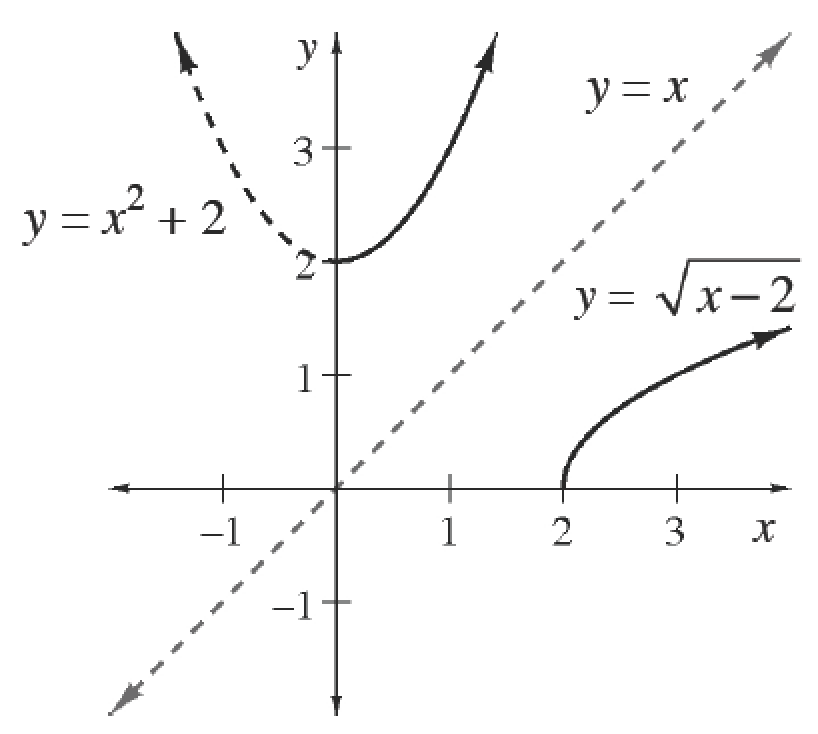
INVERSE FUNCTIONS
Let
Write an equation for
. What do you notice? Functions such that
are called inverse functions. Explain why this notation shows that and are inverse functions. If
, write the equation of a function such that .
An inverse function undoes what a function does. For example,
Write each of the statements below entirely in symbols.
The inverse sine of
is .
When the inverse of the function
is applied to , the result is .

Inverse Functions
Note: The domains of some functions must be restricted in order for the inverses to be inverse functions of each other.
For example
If we graph
If a function satisfies the horizontal line test, then an inverse function exists.
In parts (a) and (b), solve for
Now write the inverse equations of
and . What do you notice?
Study the table for the functions
and at right. does not have an inverse function. Explain why not. Evaluate:
If
and , what is ?

Write a possible equation for each of the following graphs. Verify your equations on your graphing calculator. 1-69 HW eTool. Homework Help ✎
.png)
.png)
Much of this course will focus on examining how functions grow. Examine two ways a straight line grows by completing the parts below. 1-69 HW eTool. Homework Help ✎
Sketch
. What are , , , and ? How does grow as increases? Sketch
. What are , , , and ? How does grow as increases?
Selected values of a continuous even function are shown below. 1-70 HW eTool Homework Help ✎
What are
, , and ? Sketch a possible graph of the function on the domain
. Sketch another possible graph of the function on the domain
. Can the graph be a quadratic function? If so, write a possible equation for the function. If not, explain why not.
State the domain of each of the following functions. Homework Help ✎
Helen thinks
Use various values of
to check whether or not Helen is correct. Write an accurate expression for
.
Sketch
Review your work from problems 1-25 and 1-36. Use a similar process to approximate the area under the curve for
using: Six left endpoint rectangles.
Six right endpoint rectangles.
Six trapezoids.
Which approximations were overestimates of (greater than) the actual area? Which were underestimates? Explain.
Which approximation is the most accurate? Explain.
Use interval notation to state the domain and range of each function below. Homework Help ✎
.png)
.png)
A can of soda is
Time (min) | |||||||
Temp. ( |
Sketch a graph of this situation.
When is the temperature changing the fastest? How can you see this on the graph?
Approximately how fast is the temperature changing during the first
minutes? How can you tell?
.png)
Each of the continuous functions in the table below is increasing, but each increases differently. Match each graph below with the function that grows in a similar fashion in the table. Homework Help ✎
.png)
.png)
.png)